Pay the dry claims first.
Flood Extent Mapping lays the observed water over your exposure file, so the addresses outside the water move to pay and the rest go to an adjuster with a map attached.
- Inside
- Outside
- Ambiguous
The desk review
- News photos
- Gauge reports
- Advisories
- Catastrophe bulletin
With Flood Extent Mapping
- GSD
- 0.5–2 m (high resolution)
- Cadence
- Event driven
- Platform
- High-resolution satellite
- Spectral
- Multispectral
Where the desk review runs out
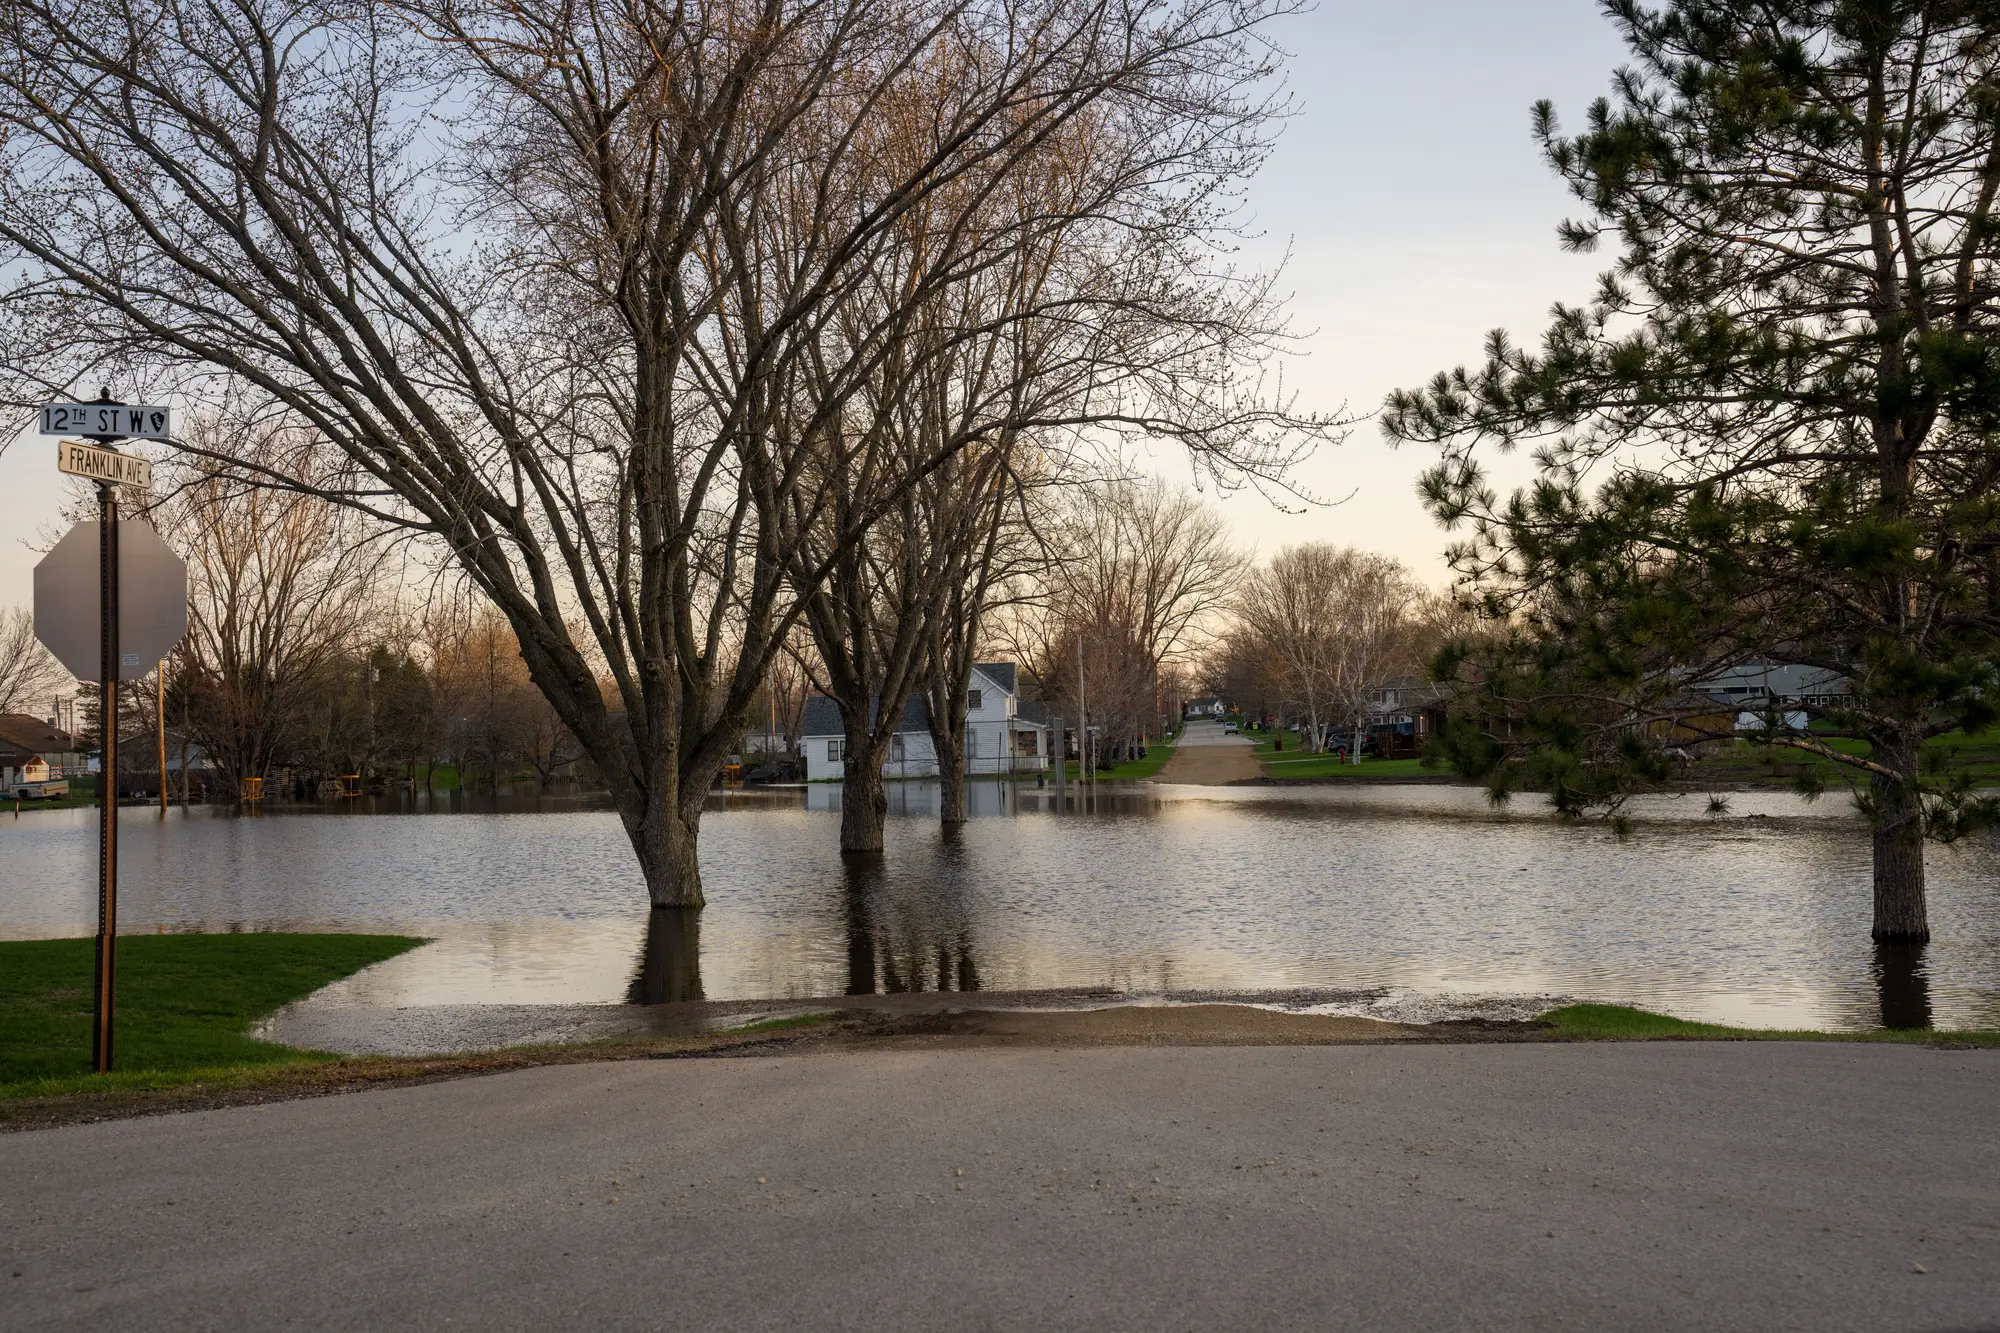
The flood comes through and first notices of loss start landing in the queue. The cat desk needs to know which insured addresses went under, and the only way to find out is to look, one address at a time, against news photos, gauge reports and whatever the catastrophe bulletin says. It is slow and it is partial.
Meanwhile adjusters get dispatched by territory or by the order the notices came in, so some of them drive to houses that stayed dry while a flooded block waits. Claims that could be paid are sitting in the same line as claims that need a person on site.
The triage, step by step
| Step | The desk review | With Flood Extent Mapping |
|---|---|---|
| 01Knowing where the water was | News photos, gauge reports, advisories and the catastrophe bulletin, pieced together into a rough picture of the affected area. | One water extent polygon drawn from imagery of the event area, dated to the pass it came from. |
| 02Checking each address | Staff look up addresses one by one and judge from the photos whether the property was likely under water. | Your exposure file is intersected with the polygon, and every address comes back tagged inside, outside or ambiguous. |
| 03Choosing what pays without a visit | Claims wait in notice order, or get held until someone has time to check them. | The addresses clearly outside the water are a tier of their own, ready for you to push to straight-through pay under your own rules. |
| 04Sending an adjuster | Dispatch follows territory or the order notices came in, so visits are spread across wet and dry addresses. | Inside and ambiguous addresses are ranked on one triage list, and each goes out with an adjuster packet, a map clip of that address against the water. |
| 05Addresses at the water's edge | A judgment call from a photo, or a visit to find out. | These come back flagged ambiguous and go to an adjuster rather than being paid or declined on the map. |
| Still yours | Every call on an edge address, the coverage decision and the payment rules for the outside tier. | |
| 06The claim file | Photos, links to news coverage and notes on why an address was handled the way it was. | The polygon, the tier and the map clip go into the file as a dated record of what the imagery showed. |
What arrives after the imagery lands
Water extent polygon
The mapped outline of the water across the event area, dated to the imagery. It answers "where was the water" without a photo round.
Exposure intersection
Each address in your exposure file tagged inside, outside or ambiguous against the polygon.
Triage list
Your addresses ranked by tier, ready to load next to your claim queue and join on policy or claim number.
Adjuster packet
A clip of the address against the water for the adjuster's dispatch. It goes with the assignment.
From event to triage list
Send the event area and your exposure file. We pull the first clear pass of high-resolution multispectral imagery over the area, map the water, and intersect it with your addresses.
- 01
Event area and exposure file in
The area hit by the event, and your exposure file with the policy locations.
- 02
First clear pass
We use the nearest usable pass once skies clear after the event.
- 03
Water mapped and intersected
The water is cut out of the imagery as a polygon, then each address is tagged against it.
- 04
Triage list out
You get the ranked list, the polygon and the map clips, within the first days of the event.
Limits
It is a first sort
The tiers decide who gets paid quickly and who gets a visit first. They do not replace an adjuster on inside or ambiguous addresses.
Clouds and timing
Optical imagery needs a clear pass. Cloud after the event can delay delivery, and we can't promise a pass on a given day.
Resolution floor
At 0.5–2 m a pixel runs from about 20 inches to about 6.5 feet across. That is enough to put water against a parcel. The edge of the water is uncertain at that scale, so an address close to the line is called ambiguous.
What the imagery can't see
Water under trees, in deep shadow or under a roof is hard to read from above, and a flood that has already receded before the pass shows nothing. Those addresses are flagged, not guessed.
Extent only
It maps where the water was. It does not grade damage to a building, estimate repair costs or set a reserve.
Who it's for
For
- Claims operations leads at regional P&C insurers triaging a flood-hit book
- Cat desks that dispatch adjusters after a flood and want to rank the list first
- Teams that have an exposure file with locations they can send
Not for
- Per-building damage grading or structural assessment
- Repair cost estimates or loss reserves
- Paying or denying boundary claims without an adjuster
- Live flood monitoring during the event
Questions before your next event
Does this replace the adjuster?
No. It decides which claims need one first. Adjusters still handle inside and ambiguous addresses.
What if it is cloudy over the event area?
Optical imagery needs a clear pass, so we wait for one and keep trying. We can't guarantee an image on a given day.
How reliable is the polygon at a single address?
It shows where the water stood across the event area. At the edge of the water the line is uncertain, and those addresses come back as ambiguous for an adjuster to settle.
What resolution is the imagery?
Between 0.5 and 2 m. That is enough to put water against a parcel, and not enough to see damage to a building.
Can you grade damage severity?
No. Severity grading sits in a separate product. This maps extent against your exposure file and nothing more.
How do we check it against our own records?
Take a flood you have already worked. Send the event area and the exposure file without your outcomes, and compare our tiers with what your adjusters found.
What do we send, and what do we get back?
The event area and your exposure file. You get the water polygon, a tier for each address, the ranked list and the map clips.
Will it load into our claims system?
It comes as files, a GIS layer and a CSV. We don't write into your claims system.
Who owns the imagery and the results?
Ownership and licence terms are agreed in writing when you get started. Ask earlier if your legal team needs them.
How is it bought and priced?
We scope it with you. Tell us how you run a flood event and we'll come back with how it would work for you.
Send the exposure file from your next flood.
Give us the event area and your exposure file. We'll tell you what the imagery can show and how fast a clear pass is likely.
Get started